
A Data Platform for Research and Clinical Trials
Image Data Management with the power to scale your business and a solution user love!
CURE8 for Clinical Trials
- Offers a browser-based interface for image transfer, storage, sharing, and analytics.
- Enables customizable workflows and integration with external applications for trial-specific needs.
- Provides seamless integration with EXINI’s imaging biomarker solutions
- Facilitates clinical trials with complete audit trails and data version control
CURE8 for Research
- Supports image collection, sharing, analysis, and results dissemination for all research institutions.
- Facilitates reproducible research with complete audit trails and data version control.
- Ensures secure dataset handling with de-identification, access control, and data transfer tools.
- Integration with EXINI´s imaging biomarker solutions
CURE8 for Developers
- Provides industry-tested standards for privacy to streamline application development.
- Allows focus on application-specific functionality, reducing infrastructure concerns.
- Streamline the development of resilient apps

Foundations of CURE8
Team-Based Collaboration and Data Privacy
Users work in teams, and all data is private to that specific team.
Project Centric Data Organization
Work and data are divided into projects, with each project specifying the data to be collected.
Albums for Data Collection and Sharing
The albums act like photo albums, creating named and versioned subsets of data. They allow data collection across projects and can be shared with other teams.
Workflow Management and Data Management
Workflows define the stages data can belong to and how it moves between different stages.
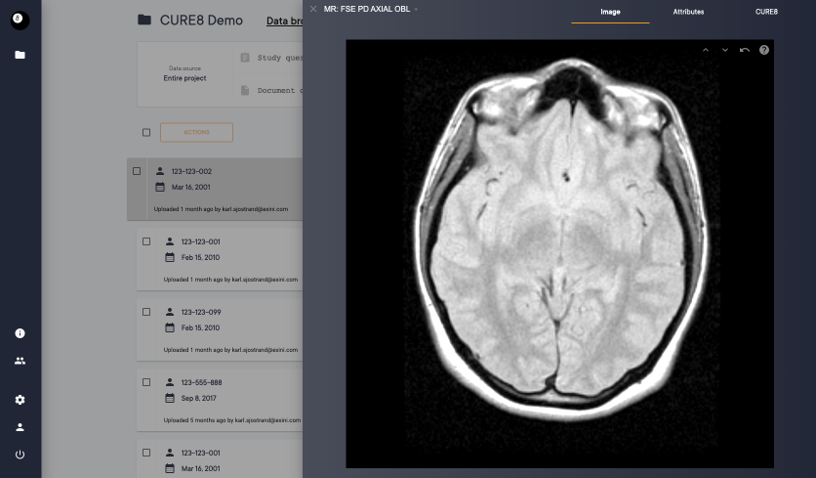
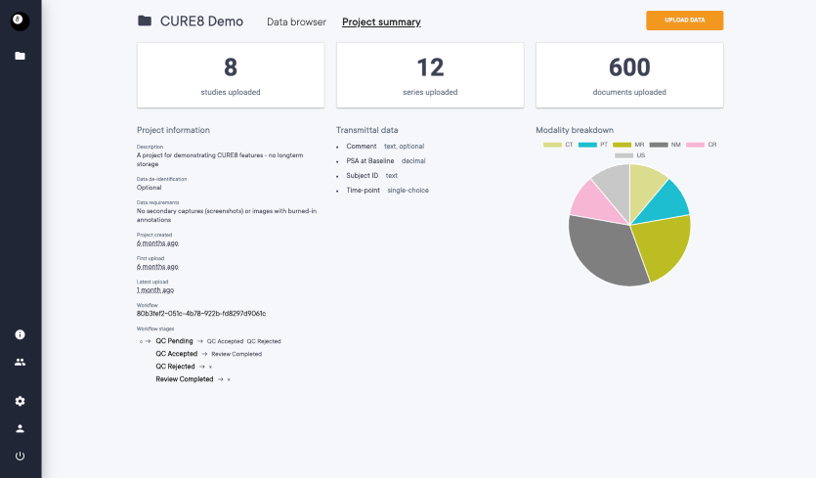
CURE8 – How it works

Enhance the Efficiency and data management accuracy in
Clinical Trials
Data management platform
- Centralized Image storage that securely store all imaging data in a cloud-based HIPAA-compliant platform
- Centralized access to large quantities of imaging and imaging-related data for faster decision-making and collaboration
- Improve Data Quality
– Automated quality checks reduce errors and improve data integrity
Clinical trials data management
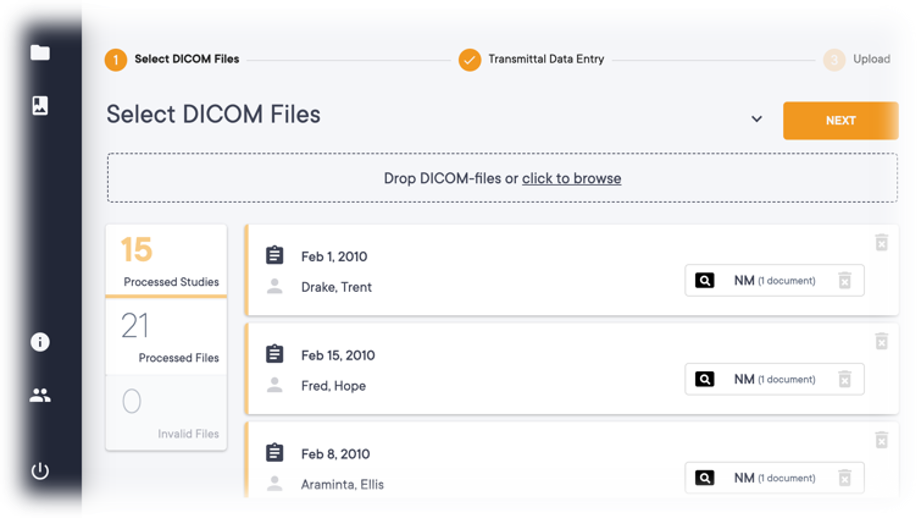
- Streamlined data collection
– Data collection
– Data curing
– Data monitoring - Improved accuracy
– Automated data validation
– Faster decision- making - Real-Time data monitoring
- Regulatory Compliance Automation
– Automated Query Management
Imaging biomarker services
- Advances imaging technology that enables precise quantitative assessments of disease states and treatment effects
- Cutting-edge solutions for detecting, measuring and monitoring disease progression and therapeutic response
- Faster, data driven decision in drug development
- Custom biomarker development with tailored biomarker strategies that fit your specific needs
Quantitative assessment of PSMA PET/CT
Standardized Whole-body PSMA disease burden reporting
Increasing Efficiency in Disease Burden Assessment
Whole-body disease quantification is automated, allowing for considerable time-savings compared to manual calculation, particularly in patients with high-burden metastatic disease 1,3,4
Clinical Utility in Treatment Eligibility and Response Assessment
Enables a standardized, streamlined approach offering automated and accurate calculation of whole body SUVmean, that can be used to determine patient eligibility for treatment with radioligand therapy. 3-6
Quantitative PSMA PET Imaging
Several recent guidelines and consensus statements from SNMMI and EANM have acknowledged the value of quantitative PSMA PET imaging biomarkers made readily available by aPROMISE 4-6


Detection and quantitation of bone metastases – Bone Scan Index
AI enabled quantification of planar bone scintigraphy
Imaging biomarker
Validated for prognosis and response in management of prostate cancer patients as well as in clinical trials (PCWG3) 1
Fast and reproducible
Automated segmentation of anatomy and hotspots in combination with accurate pre-selection of relevant hotspots creates an efficient and standardized clinical workflow.
BSI report
Standardized and complete with latest BSI value, images, comments as well as previous studies’ BSI values.
Standardized, quantitative and accurate reporting in seconds3
Brain MRI/PET Quantification and Clinical Decision Support
Fully automated quantification of FDG and amyloid PET tracers
- Extracts SUVr and Z-scores for all relevant regions of the brain and summarize Braak stages.
- Two modes of operation – PET-only and PET-MR
- Fully automatic standardized reporting on MK-6240 – Dedicated tau-PET report available
- Browser-based viewer for interactive review of results
- Easy-to-read reports are sent to PACS

Our Products

References
- Calais J, et al. J NuclMed. 2022;63(supple2):2496.
- Scher H, et al. 2016 Apr 20;34(12):1402-1418. doi: 10.1200/JCO.2015.64.2702. Epub 2016 Feb 22.
- Nickols N, et al. J Nucl Med. 2022;63(2):233-239.
- Johnsson K, et al. Eur J Nucl Med Mol Imaging. 2022;49(3):1041-1051.
- Seifert R, et al. EurUrol. 2023;83(5):405-412.
- Hope TA, et al. J Nucl Med. 2023;64(9):1417.
- Kratochwil C, et al. Eur Jour Nuc Med Mol Imaging. 2023;50(9):2830-2845.
- Jadvar H, et al. J Nucl Med. 2022;63(1):59-68.
- Armstron A, et al. JAMA Oncol. 2018 Jul 1;4(7):944-951.doi: 10.1001/jamaoncol.2018.1093.